Skip to the content.

Sequana: a set of NGS pipelines

This page serves as an additional set of resources for the Sequana project. Sequana is comprised of a Python library, the documentation of which is accessible on Read The Docs. The source code for the Python library can be found on GitHub.

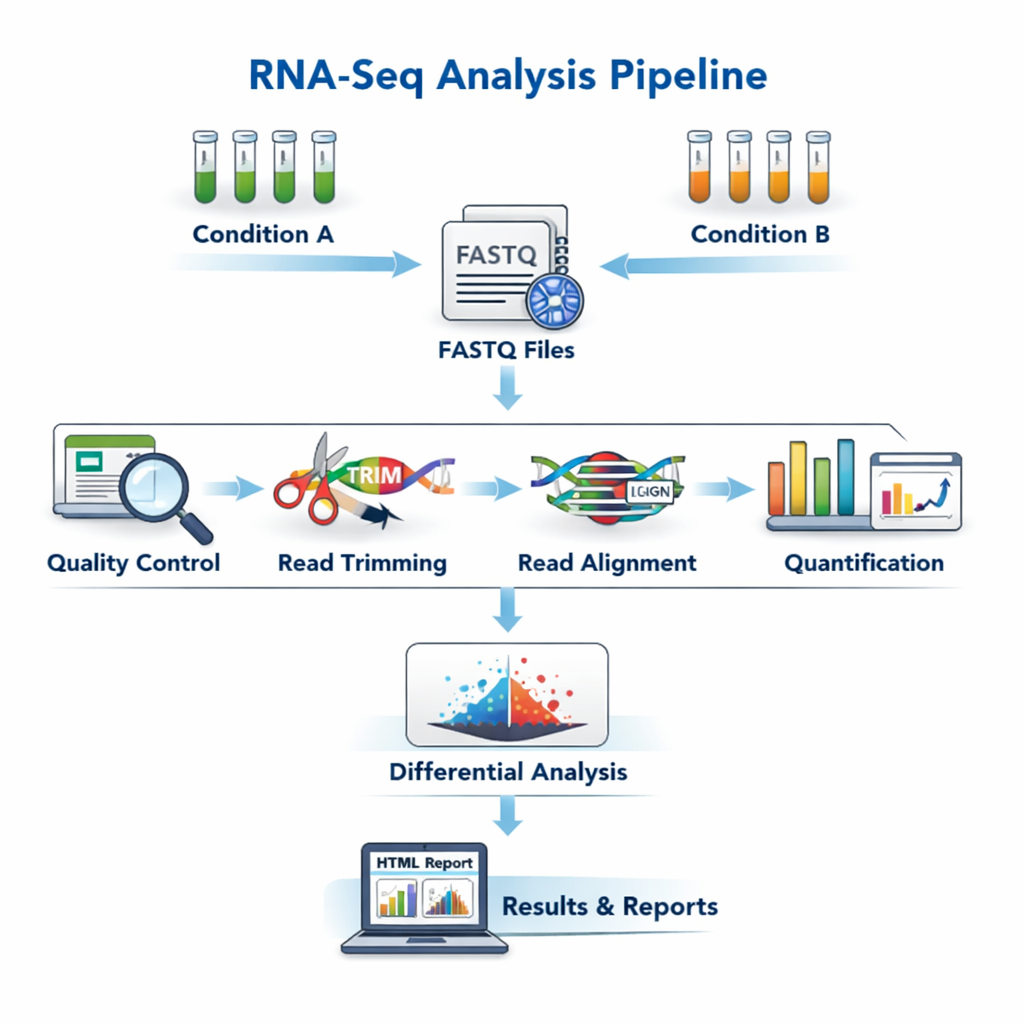
One of the primary objective of the Sequana project is to offer a collection of NGS pipelines. The pipelines currently available are located on PyPI and the Sequana GitHub organisation page, each having their own repository. For instance, the RNA-seq pipeline can be found at sequana/rnaseq.

This page is also a place for providing supplementary information to the main repositories.

Pipelines

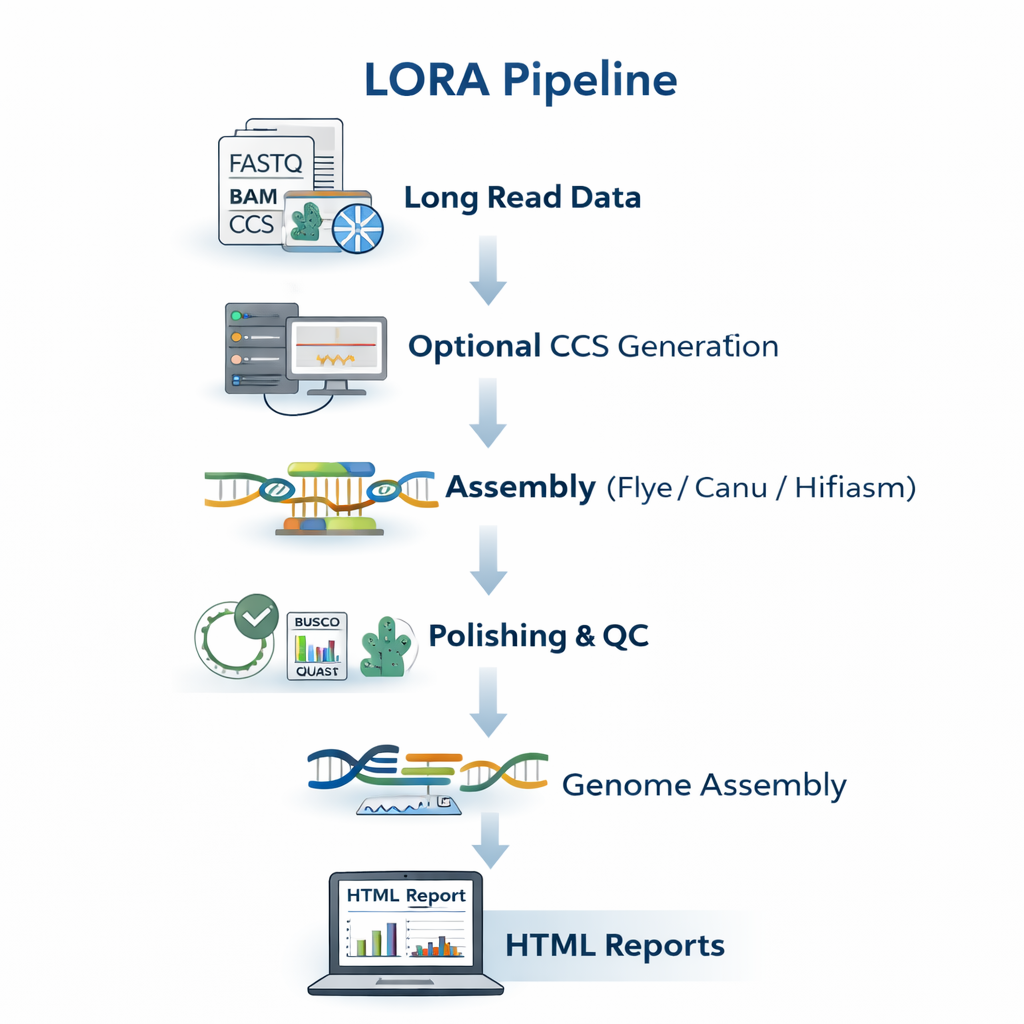
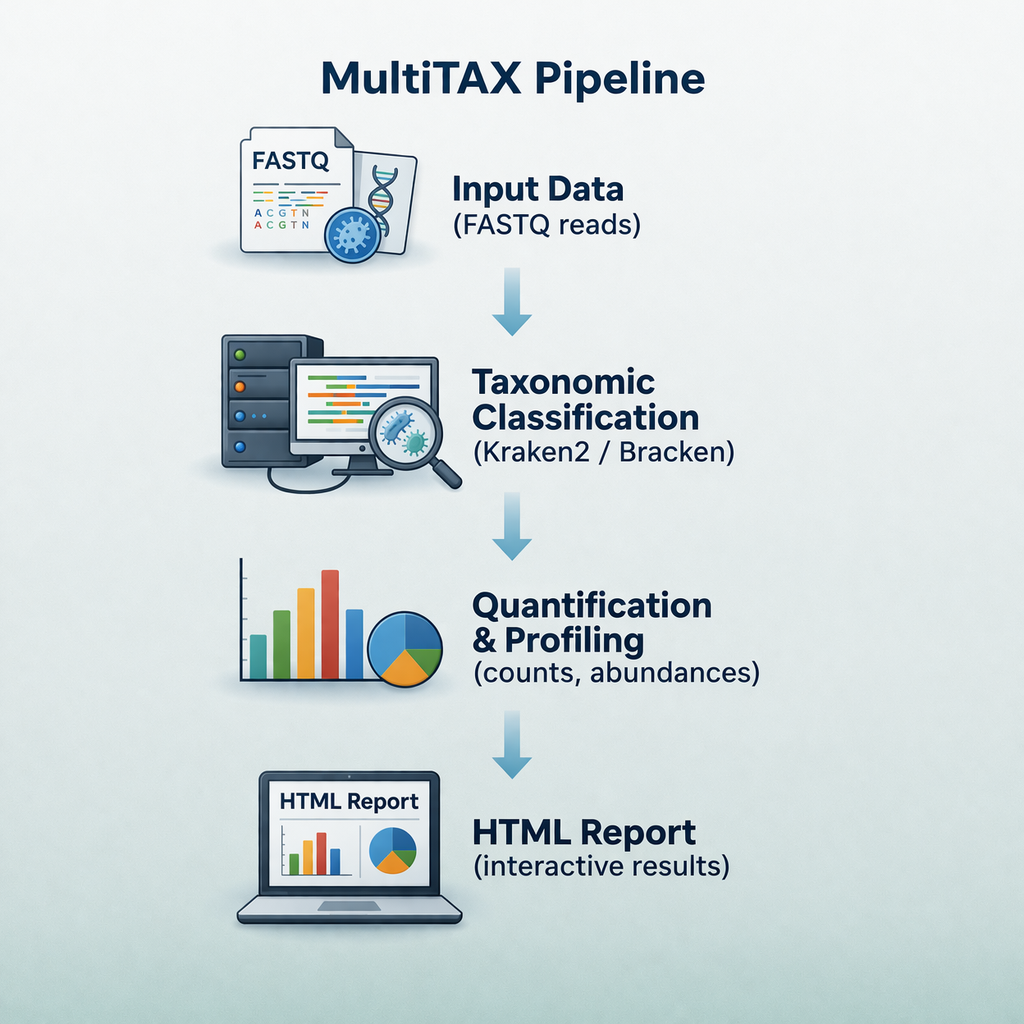
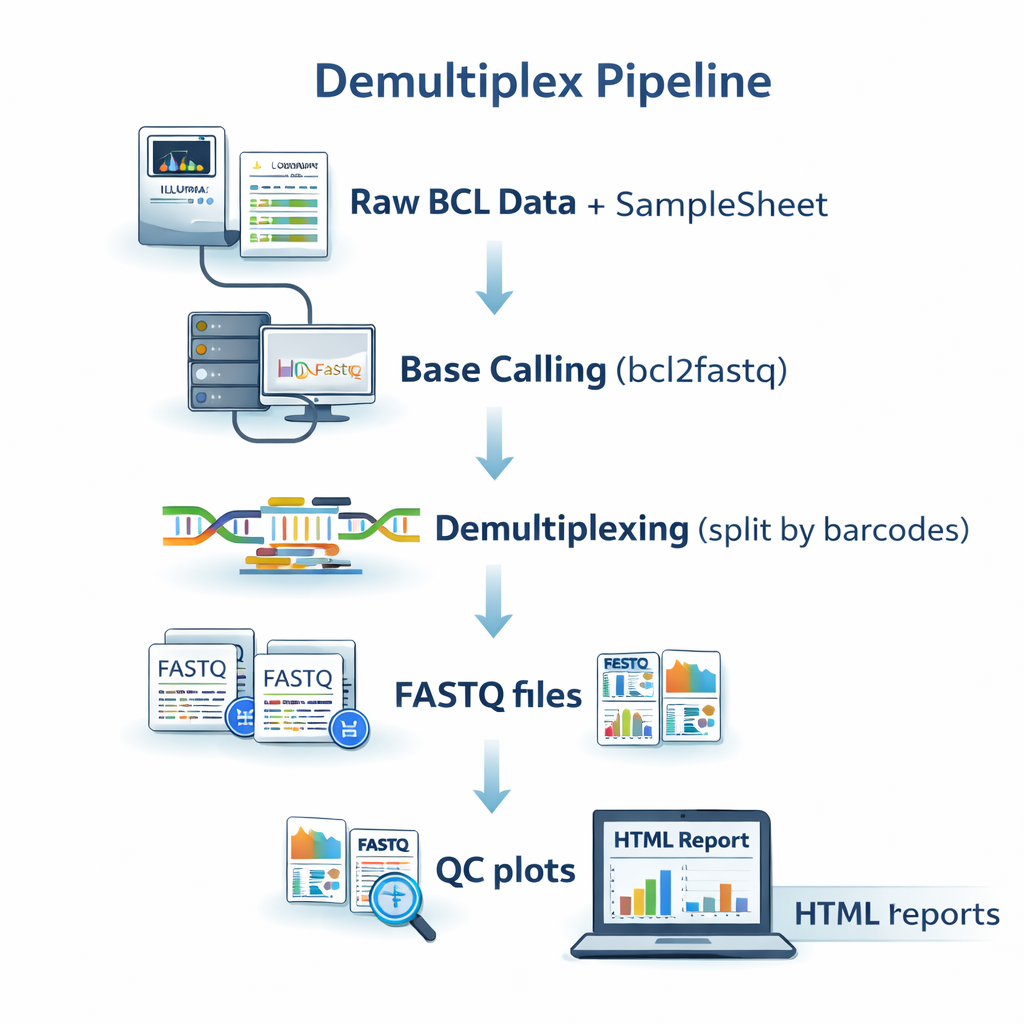
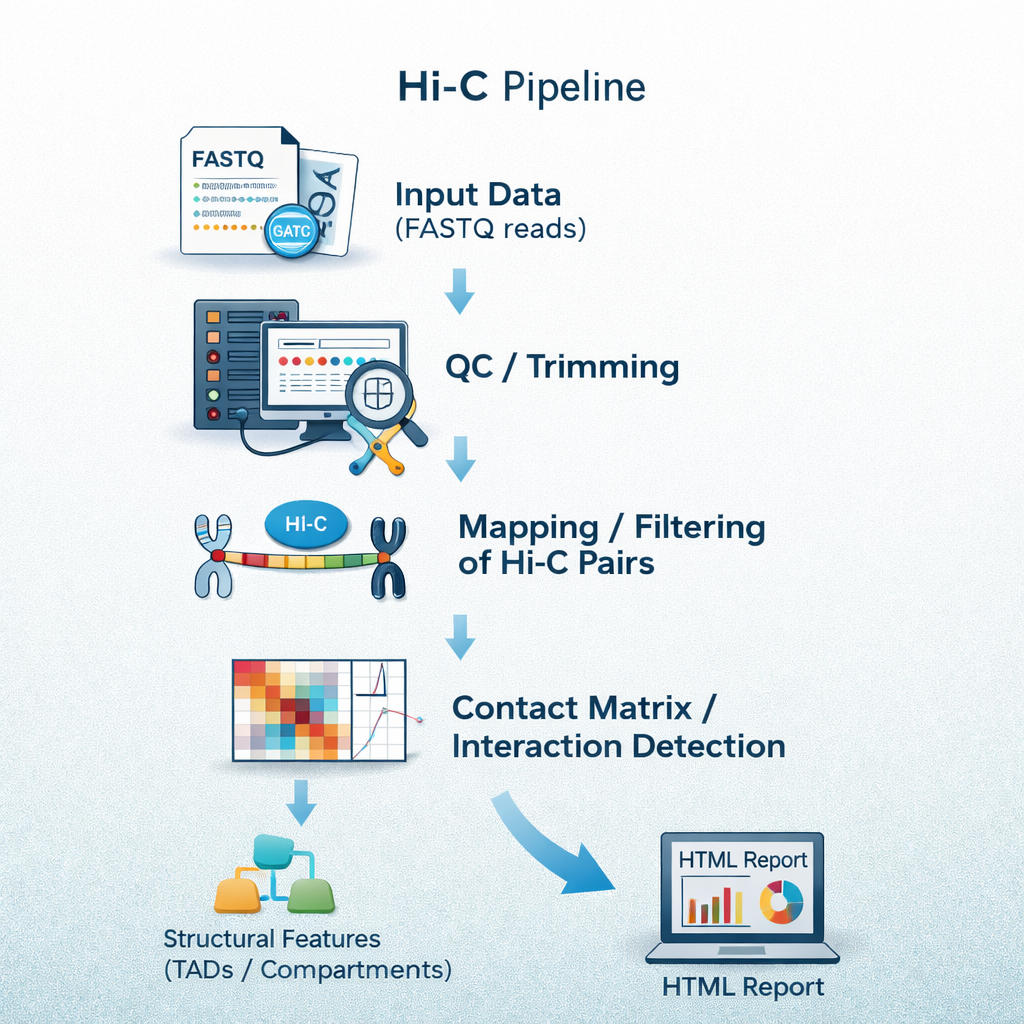
Sequana provides a collection of NGS pipelines. Each pipeline lives in its own repository on the Sequana GitHub organisation. Below are some highlighted pipelines:
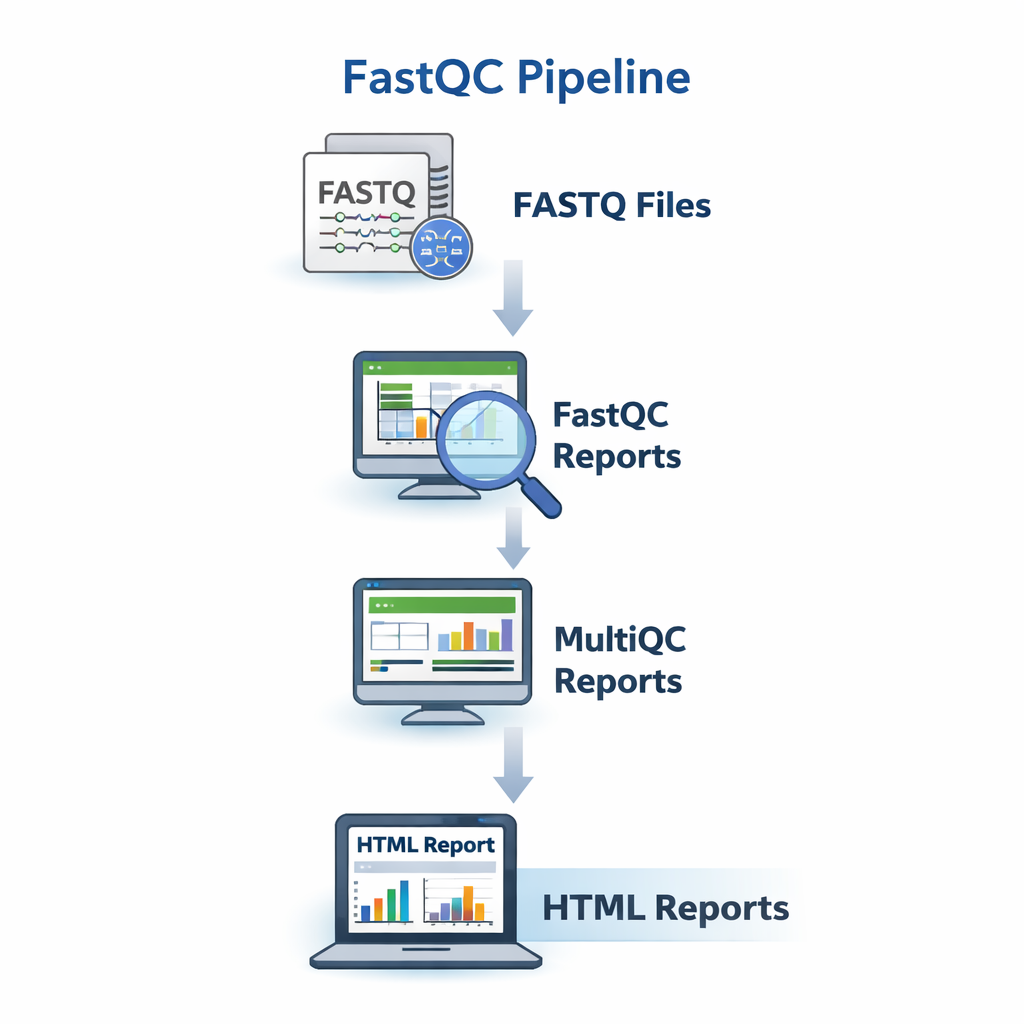
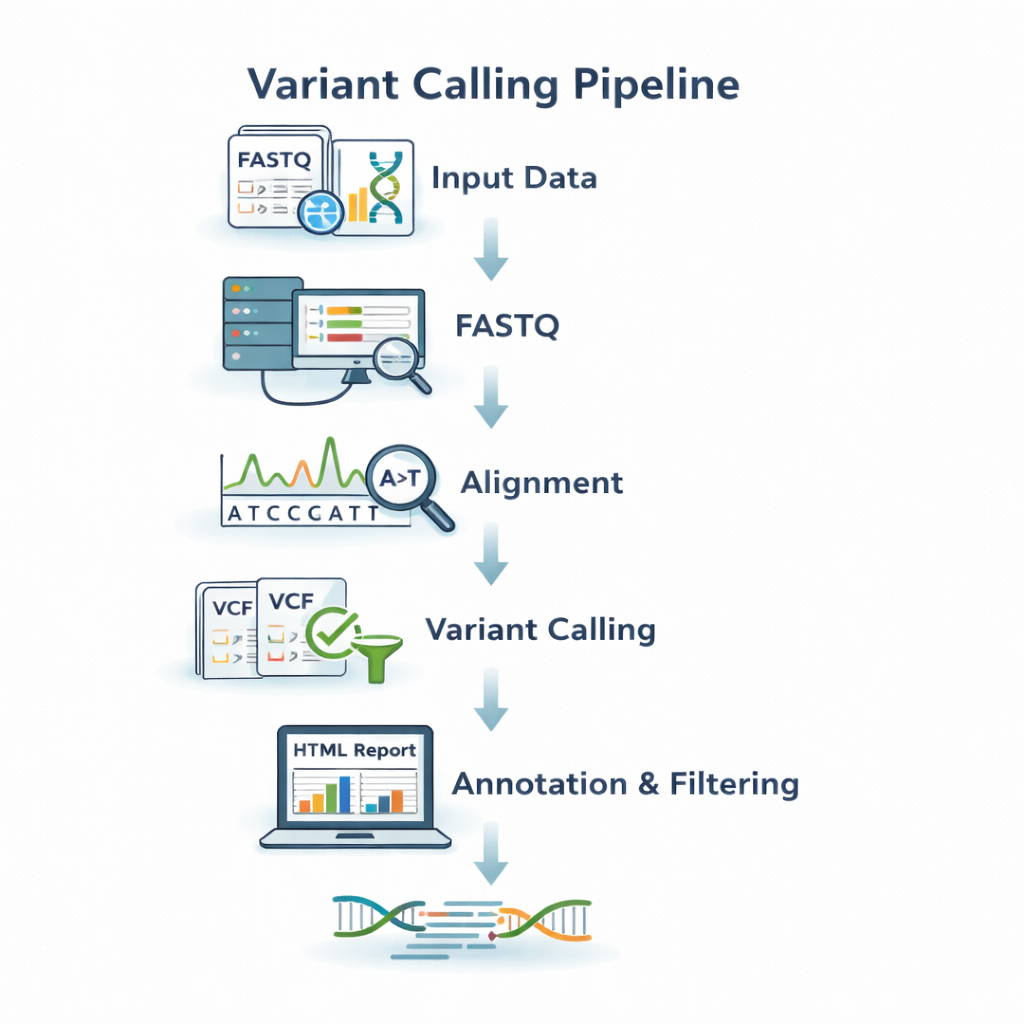
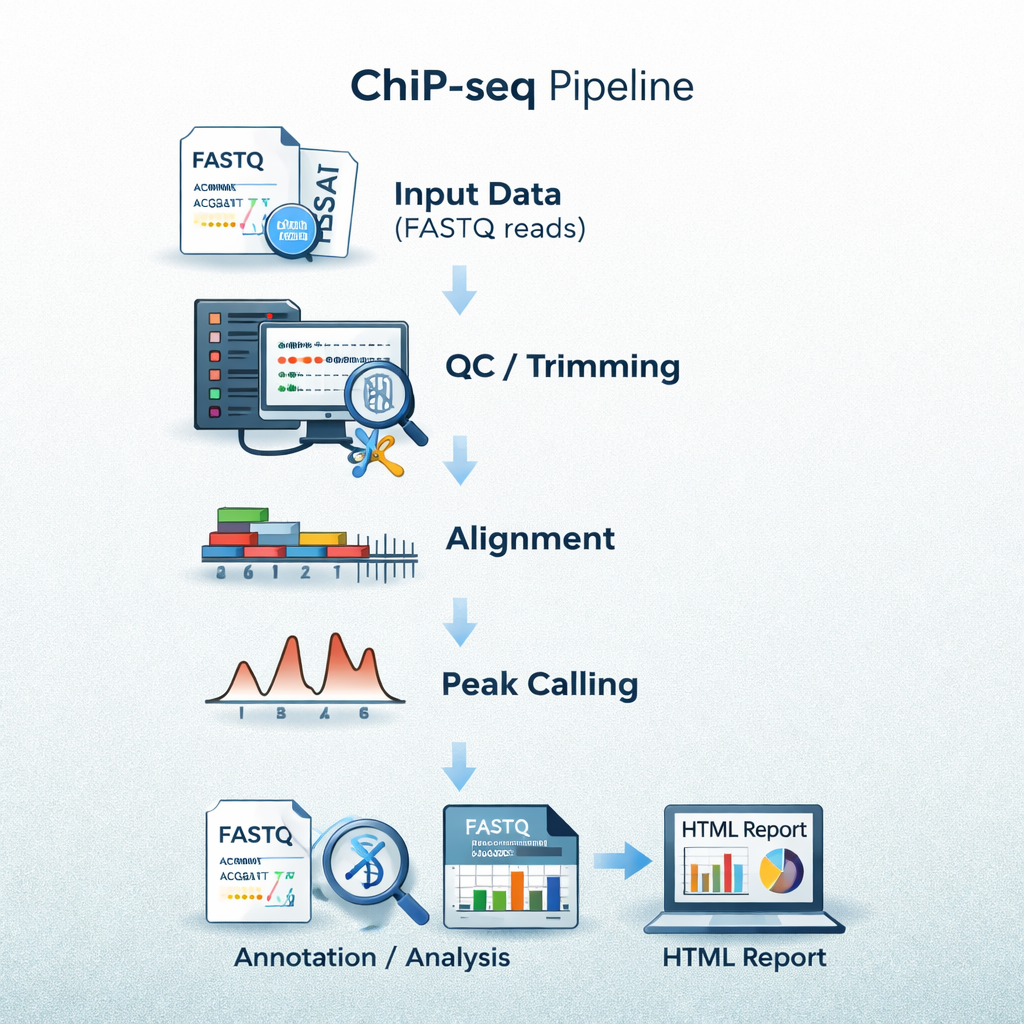
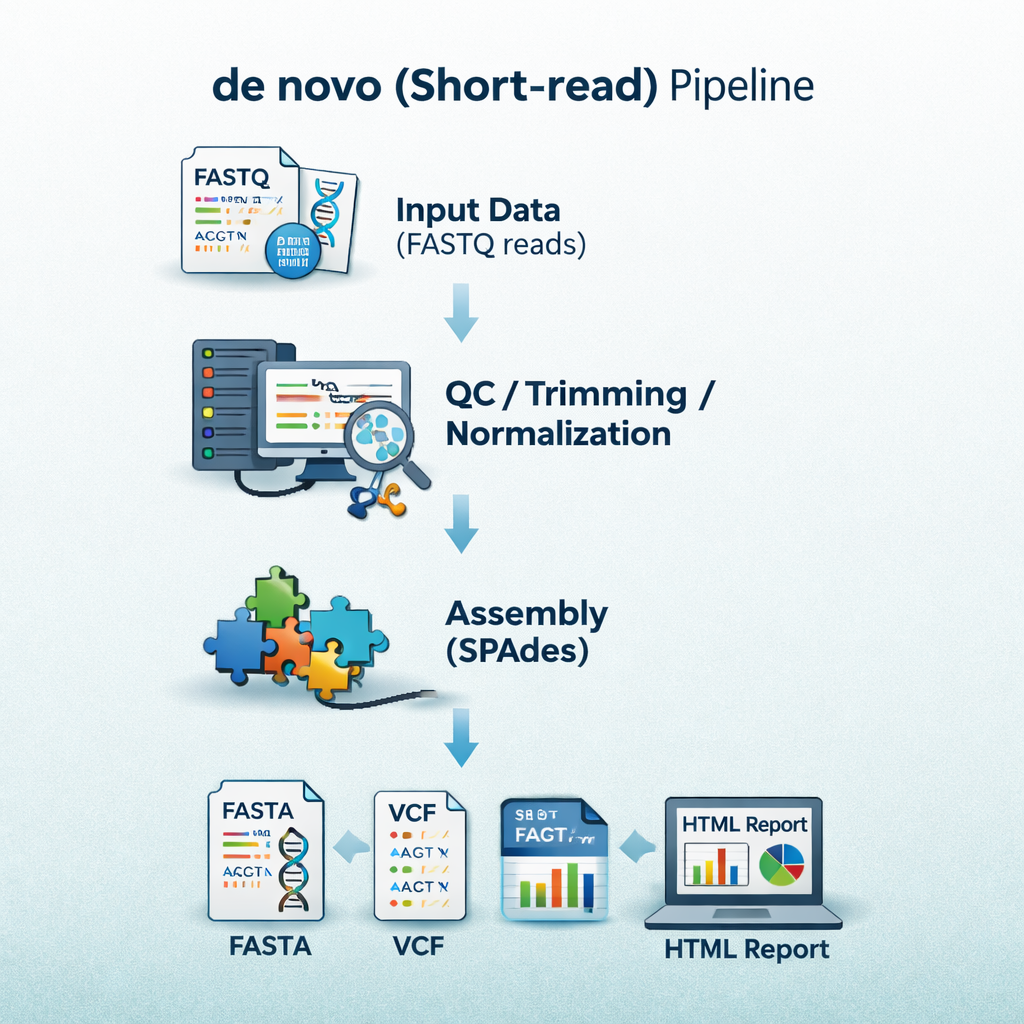
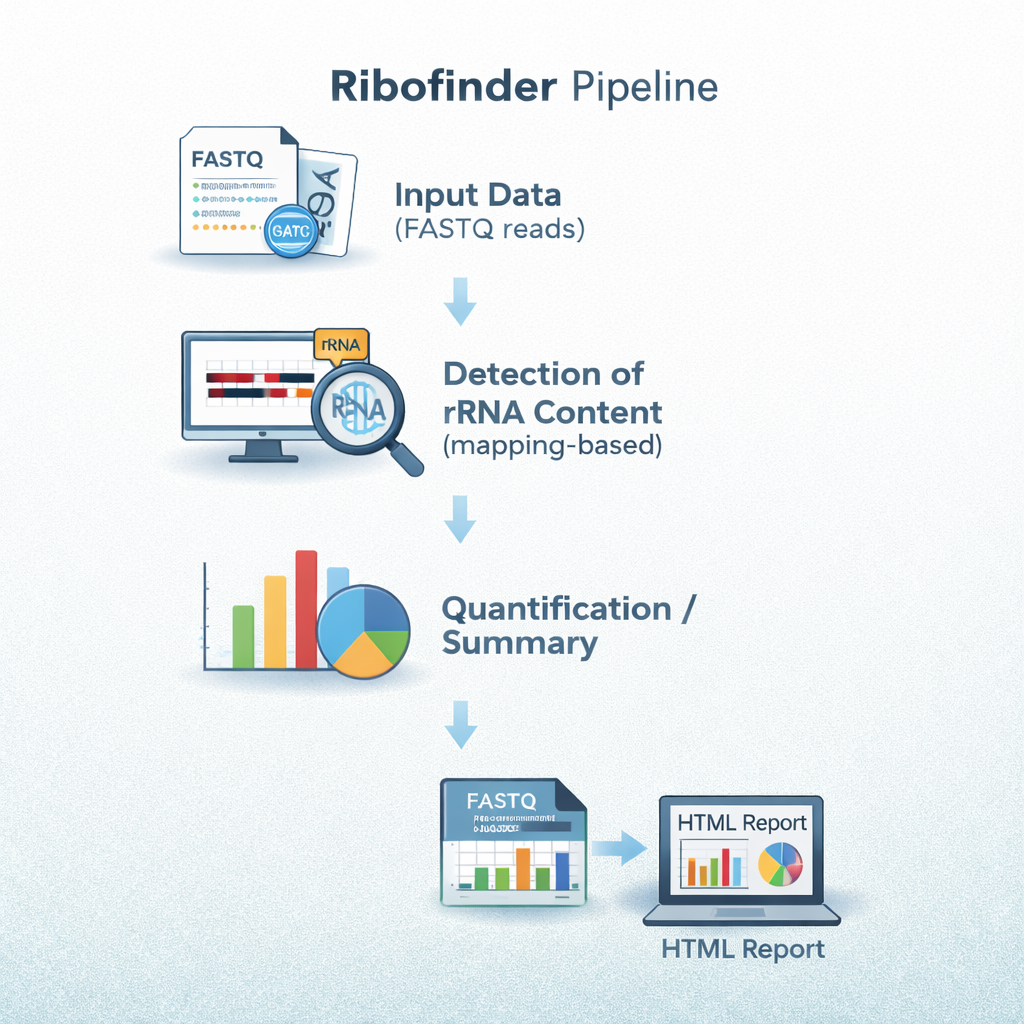
sequana_fastqc pipeline diagram placeholder
sequana_fastqc
A quality-control pipeline that runs FastQC and MultiQC on raw FASTQ files to assess sequencing quality.
sequana_rnaseq pipeline diagram placeholder
sequana_rnaseq
An RNA-seq pipeline that covers trimming, alignment, feature counting, and differential expression analysis.
sequana_variant_calling pipeline diagram placeholder
sequana_variant_calling
A variant-calling pipeline that performs read trimming, alignment, and SNP/indel detection using standard tools such as BWA and freebayes, with interactive HTML reports.
sequana_demultiplex pipeline diagram placeholder
sequana_demultiplex
A demultiplexing pipeline built around bcl2fastq / bcl-convert that converts Illumina BCL files into FASTQ files, validates sample sheets, and generates MultiQC summary reports.

Published Tools

The following tools have been published in peer-reviewed journals. Each tool is also available as a standalone application within the Sequana Python library.

Sequana Coverage — genome depth-of-coverage analysis (GigaScience 2018 Fig. 1)
Sequana Coverage
Published in GigaScience — DOI: 10.1093/gigascience/giy110
A standalone tool and Python library for fast detection of genomic regions with abnormal depth of coverage. It models coverage with a mixture of distributions, highlights regions of interest (deletions, duplications, low-complexity regions), and produces interactive HTML reports suitable for quality control of whole-genome sequencing data.
Sequanix — desktop GUI for Snakemake pipelines
Sequanix
Published in Bioinformatics — DOI: 10.1093/bioinformatics/bty034
A desktop graphical user interface (GUI) built with PyQt5 that lets users configure and execute Snakemake-based bioinformatics pipelines without writing a single line of code. Sequanix dynamically introspects a pipeline's configuration file, renders appropriate input widgets, validates parameters, and monitors pipeline progress in real time — dramatically lowering the barrier for non-expert users.

Unpublished Tools

In addition to its NGS pipelines, Sequana ships a set of standalone sub-commands that can be invoked directly from the command line (sequana <subcommand>). These tools cover common NGS utility tasks and are distributed as part of the sequana Python package.

sequana coverage
Analyse the depth of coverage of a BAM/BED file across an entire genome or targeted regions, detect abnormal coverage regions, and generate an interactive HTML report.
sequana taxonomy
Perform taxonomic classification of sequencing reads using Kraken2 or other back-ends and produce summary plots and reports for metagenomics studies.
sequana summary
Compute and display summary statistics (read counts, GC content, quality metrics) for one or more FASTQ files without running a full pipeline.
sequana enrichment
Perform Gene Ontology (GO) and KEGG pathway enrichment analysis on a list of differentially expressed genes, with interactive visualisations.
sequana samplesheet
Validate and convert Illumina sample-sheet files, checking for common formatting errors before demultiplexing with bcl2fastq or similar tools.
sequana gtf_fixer
Fix common inconsistencies in GTF/GFF annotation files (missing gene-level entries, non-standard attributes) so they are compatible with downstream RNA-seq tools.

Talks

Applications

Check your Illumina Sample Sheet

Report examples (click on the image)

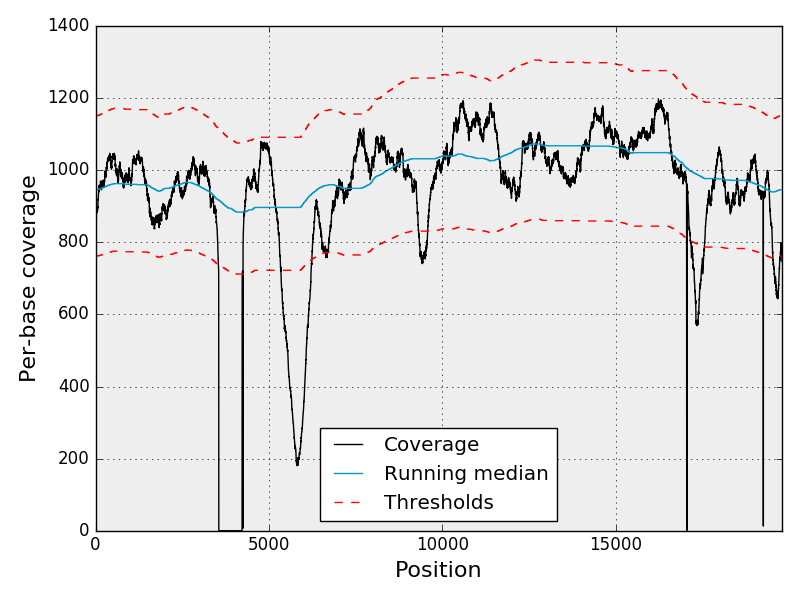
The following was generated with the Sequana Coverage standalone application and keep here a it is reference in other places. This is the coverage along a virus genome where the black dot line represent the coverage, the blue is the median coverage, and red lines are the top and bottow thresholds for detecting event of interest.